home

creative · designer

professional work

problems don’t scare me, I assure you.

experimental projects

pushing the boundaries is my challenge.

my sketches

when I’m not designing I’m drawing.

about me

I’m Gina Pont. I design and I love it.

Linkedin | info@ginapont.com | Instagram


I built this website: design, copy and front end.

Play with data

with Matteo Moretti and Domestic Data Streamers, is a workshop which explores and push the boundaries of data visualization and visual storytelling.

The challenge

We need to collect data from Elisava students. How can we encourage them to take part in this survey?.

Analysis

Wearisome | Amusing
Complex | Simple
Interaction, storytelling, visual.

Solution

Adopting visual metaphors, instead of relying on traditional text-and-chart presentation strategies: display installations in Elisava, using varied mechanisms and methodologies according to their context.

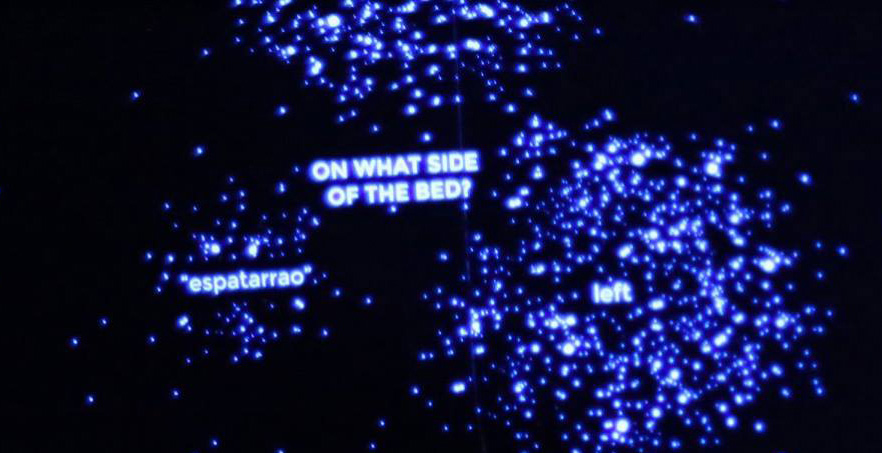
Images and pictures grab our attention and affect us emotionally in ways that text alone usually cannot. Visual metaphors, in particular — because they contextualize information — can ensure faster and far richer data processing. These visual metaphors are capable of evoking related ideas and stories, of appealing to us at both the conscious and subconscious levels, affecting us at the perceptual, cognitive and reflective levels, and of eventually captivating our mind.

Collecting data with bins.
Collecting data with post-its and an elevator.
Collecting data with an ultraviolet light.

Eager to know more? Say hi at linkedin or info@ginapont.com